


NOAA’s Climate.gov provides scientific data and information about climate to the public and decision-makers. They promote an increased understanding of climate science and climate-related events and makes data products and services easy to access and use. Data Snapshots is a clean and compact Graphical User Interface that displays archived NOAA data visualizations, and provides textual descriptions of each of the maps. Users choose among various data products within categories that include: Temperature, Precipitation, and Drought. Results can be further filtered by date, while the maps can be downloaded at various resolutions.
Working with the Climate.gov content producers, I helped discover application requirements and functionality. Armed with this information, I designed the UI/UX and programmed a dynamic and interactive client-side interface. I worked concurrently with the data visualization team to develop the style requirements for proper production and display of the maps.
Technologies: HTML 5, CSS 3, JavaScript, jQuery, AJAX, JSON, PHP, and MySQL
Data Snapshots embedded within the Climate.gov website.
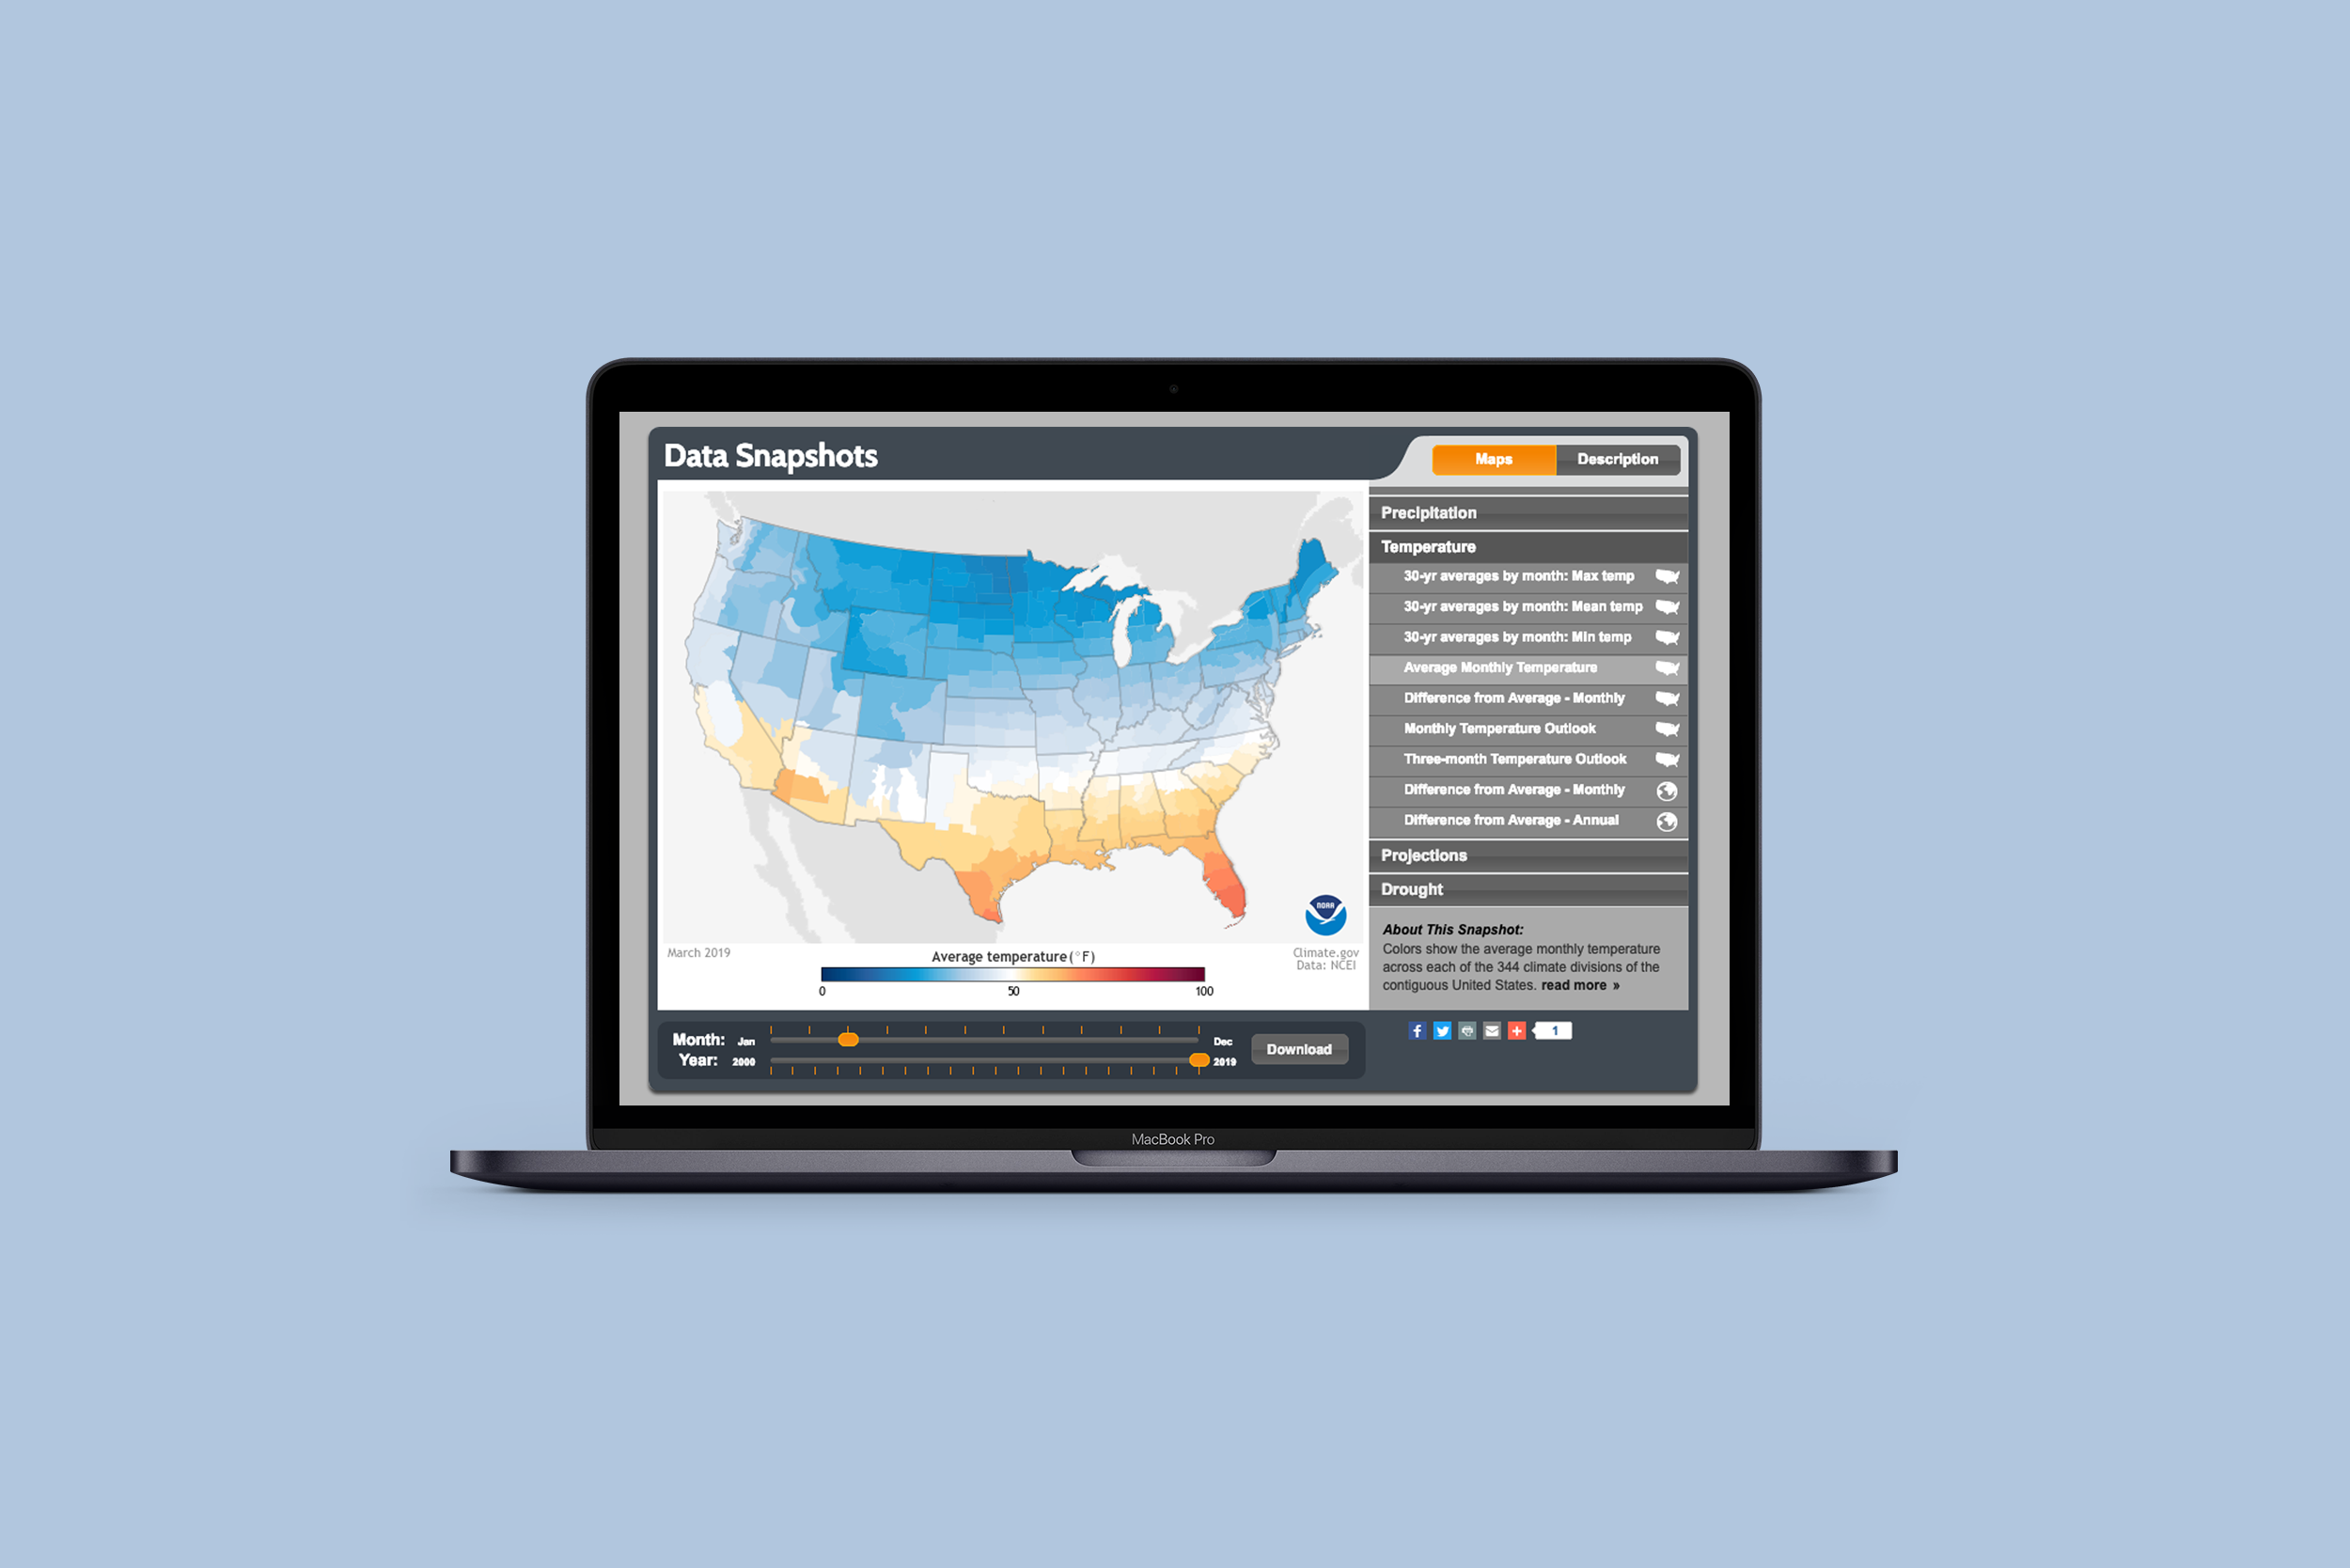
User can select from a range of archived map data from a menu of NOAA data products.
Each map has accompanying text that explains how to interpret the map, and where the data is collected.
Maps can further be filtered by selecting from the date range sliders found underneath the map.
All maps are downloadable and are provided in a range of popular resolutions.